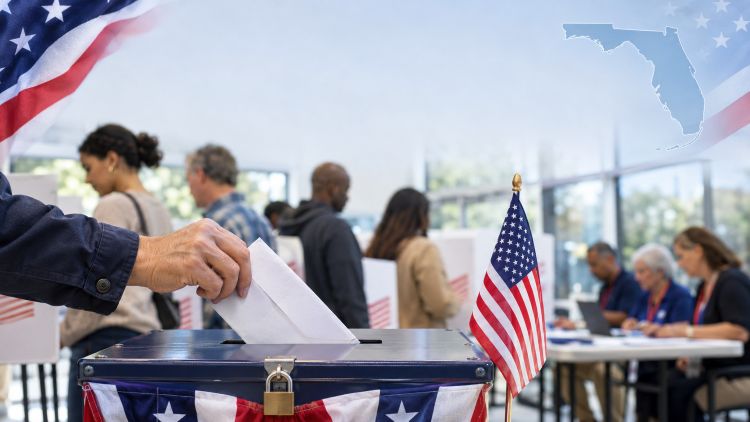
Republicans and Democrats in early voting: the percentages, the differences and the picture in Florida
Greek News & Radio FL | Tuesday, November 3, 2026
The United States is currently in the midst of a highly political election. Millions of Americans are heading to the polls for the 2026 midterm elections, which will determine the new composition of the House of Representatives and part of the Senate.
The election comes midway through Donald Trump's second term as president and is a major test of political connections in Washington. The focus is on whether Republicans will retain their majority in Congress and in which districts Democrats will be able to strengthen their presence.
Even before the November 3rd vote is complete, early turnout data shows strong citizen mobilization.
Nearly 60 million Americans voted before Election Day
According to the University of Florida Election Lab, as of 8:21 a.m. on November 3, 59.014.258 early votes had been cast. Of those, approximately 31,9 million were cast in person and 27,1 million were cast by mail.
This recording reflects participation so far and not the count of votes in favor of the candidates.
A second source, the On Point Politics platform, lists 54.934.753 votes from 47 states. The difference is due to the different coverage and timing of the two systems.
Which party has the largest presence in early voting?
On Point Politics compiles data from state election agencies. Where official party registration data is not available, it uses statistical estimates.
In the 25 states that publish party registration data, early voters are distributed as follows:
Democratic Party: 40,1 %
Republican Party: 33,0 %
Independents and other parties: 26,9 %
These percentages do not correspond to the votes received by the candidates. They show the party registration of citizens who voted early. This is important because a registered Democrat can vote for a Republican candidate and vice versa.
Analytical table: The picture in the 50 states
The table presents the percentage of early participation corresponding to each party, according to published data and estimates by On Point Politics.
States with an asterisk (*) do not publish official party registration data for early voting, so their rates are statistical estimates.
States with an asterisk (*) do not publish official party registration data for early voting, so their rates are statistical estimates by On Point Politics.
| State | Democrats | Republicans | Higher percentage |
|---|---|---|---|
| Alabama | No data available | ||
| Alaska* | 21,0 % | 28,2 % | Republicans |
| Arizona | 37,2 % | 38,0 % | Republicans |
| Arkansas | 6,3 % | 9,0 % | Republicans |
| California* | 56,6 % | 27,7 % | Democrats |
| Colorado | 30,3 % | 24,5 % | Democrats |
| Connecticut | 51,5 % | 18,2 % | Democrats |
| Delaware | 52,9 % | 27,7 % | Democrats |
| Florida | 37,8 % | 40,1 % | Republicans |
| Georgia* | 42,8 % | 34,4 % | Democrats |
| Hawaii* | 52,4 % | 26,1 % | Democrats |
| Idaho | 19,0 % | 62,4 % | Republicans |
| Illinois* | 56,4 % | 18,4 % | Democrats |
| Indiana* | 37,6 % | 37,5 % | Marginal Democrats |
| Iowa | 46,1 % | 33,8 % | Democrats |
| Kansas | 40,8 % | 43,3 % | Republicans |
| Kentucky | Contradictory evidence in the source (**) | ||
| Louisiana* | 38,8 % | 40,6 % | Republicans |
| Maine | 46,7 % | 22,9 % | Democrats |
| Maryland | 69,5 % | 15,1 % | Democrats |
| Massachusetts | No data available | ||
| Michigan* | 53,1 % | 19,4 % | Democrats |
| Minnesota* | 48,9 % | 20,1 % | Democrats |
| Mississippi* | 36,2 % | 37,1 % | Republicans |
| Missouri* | 28,3 % | 47,0 % | Republicans |
| Montana* | 42,0 % | 28,8 % | Democrats |
| Nebraska | 38,4 % | 44,2 % | Republicans |
| Nevada | 39,3 % | 33,7 % | Democrats |
| New Hampshire | No data available | ||
| New Jersey | 56,7 % | 23,6 % | Democrats |
| New Mexico | 51,6 % | 31,0 % | Democrats |
| New York* | 60,2 % | 20,3 % | Democrats |
| North Carolina | 38,4 % | 26,1 % | Democrats |
| North Dakota* | 25,5 % | 47,6 % | Republicans |
| Ohio* | 40,8 % | 33,1 % | Democrats |
| Oklahoma | 41,8 % | 44,6 % | Republicans |
| Oregon | 40,8 % | 30,7 % | Democrats |
| Pennsylvania | 64,8 % | 25,2 % | Democrats |
| Rhode Island | 42,7 % | 10,1 % | Democrats |
| South Carolina* | 27,3 % | 48,8 % | Republicans |
| South Dakota | 28,9 % | 53,8 % | Republicans |
| Tennessee* | 23,0 % | 48,8 % | Republicans |
| Texas* | 34,0 % | 42,3 % | Republicans |
| Jute | 19,7 % | 52,5 % | Republicans |
| Vermont* | 61,6 % | 20,7 % | Democrats |
| Virginia* | 47,4 % | 25,1 % | Democrats |
| Washington* | 66,3 % | 18,1 % | Democrats |
| West Virginia | 39,0 % | 40,8 % | Republicans |
| Wisconsin* | 46,1 % | 22,8 % | Democrats |
| Wyoming | 16,8 % | 75,4 % | Republicans |
(**) For Kentucky, On Point Politics gives two different sets of percentages on the same page, so we do not list them.
Note: The table shows which party has the largest share of early voters, based on party registration or estimated party composition. It does not show election victories, candidate leads, or predicted results. The percentages of the two parties do not add up to 100%, because there are also independent voters and other parties.
Source: On Point Politics, November 3, 2026.
(**) For Kentucky, the On Point Politics gives two different sets of percentages on the same page, so we don't list them.
Note: The table shows which party has the largest share of early voters, based on party registration or estimated party composition. It does not show election victories, candidate leads, or predicted results. The percentages of the two parties do not add up to 100%, as there are also independent voters and other parties. Minor discrepancies from other sources are due to different reporting times.
Florida: Over 5,4 million have already voted
Of particular interest is Florida, one of the largest states in the USA and home to a significant number of Greek Americans.
According to On Point Politics, approximately 5,47 million early votes had been cast as of November 3. Of those who voted:
- About 2,20 million were registered Republicans.
- About 2,07 million were registered Democrats.
- About 1,21 million were independents or registered with other parties.
Registered Republicans lead in early turnout by about 129.000 voters.
The picture changes when you look at the turnout for each party. According to data from the Florida Division of Elections, as compiled by Fresh Take Florida, about 49,8% of registered Democrats had already voted, compared to 38,6% of Republicans and 31,1% of independents.
On the other hand, Republicans have about 1,5 million more registered voters in Florida than Democrats, and the party expects a strong voter turnout today, Election Day.
Florida also has different voting patterns by region. In large urban areas of South Florida, such as Miami-Dade and Broward, political balances differ from those in northern, more rural counties.
None of this data shows how citizens voted. It only shows who voted.
Texas and California: Two different images
Texas has recorded about 6,86 million early votes. On Point Politics' model estimates a higher turnout of voters affiliated with the Republican Party: 42,3% Republican and 34,0% Democratic.
In contrast, in California, where approximately 6,66 million early votes have been recorded, the same model estimates a greater presence of Democrats, with 56,6% versus 27,7% of Republicans.
In both states, these are estimates, because no official party registration data for early voting is published.
The states that are of particular interest
In North Carolina, registered Democrats represent 38,4% of early voters and Republicans 26,1%.
In Georgia, the model estimates 42,8% for Democrats and 34,4% for Republicans.
In Arizona the picture is more balanced: 38,0% of early voters are registered Republicans and 37,2% Democrats.
In Nevada, the corresponding proportions are 39,3% Democrats and 33,7% Republicans.
These differences do not automatically translate into election predictions. The final results will be judged by election day turnout, independent voters, and the choices of citizens themselves.
Why are these elections important?
Midterm elections are held two years after the presidential elections and are a defining moment in the functioning of the federal government.
Citizens elect all 435 members of the House of Representatives, as well as about a third of the Senate. At the same time, many states hold elections for governors, state legislatures, and other offices.
The new composition of Congress will affect the legislative process, the ability to approve government initiatives, and parliamentary oversight.
For President Donald Trump, the balance of power in Congress will determine how far he can advance his agenda for the rest of his term. For Democrats, the showdown is an opportunity to gain seats and strengthen their role in Congress.
When will the results start being announced?
Among the first states to close the polls is Indiana, where voting ends at 6:00 p.m. local time, which is 6:00 p.m. Eastern Time in most of the state.
In Florida, polling places are open from 7:00 a.m. to 7:00 p.m. local time, and those in line at 7:00 p.m. can vote. Because Florida has two time zones, the first unofficial results are posted on floridaelectionwatch.gov after 8:00 p.m. Eastern Time.
Greek News & Radio FL will be monitoring the results throughout the evening.
Sources: University of Florida Election Lab, On Point Politics, Florida Division of Elections, Fresh Take Florida, Indiana Secretary of State.